
-
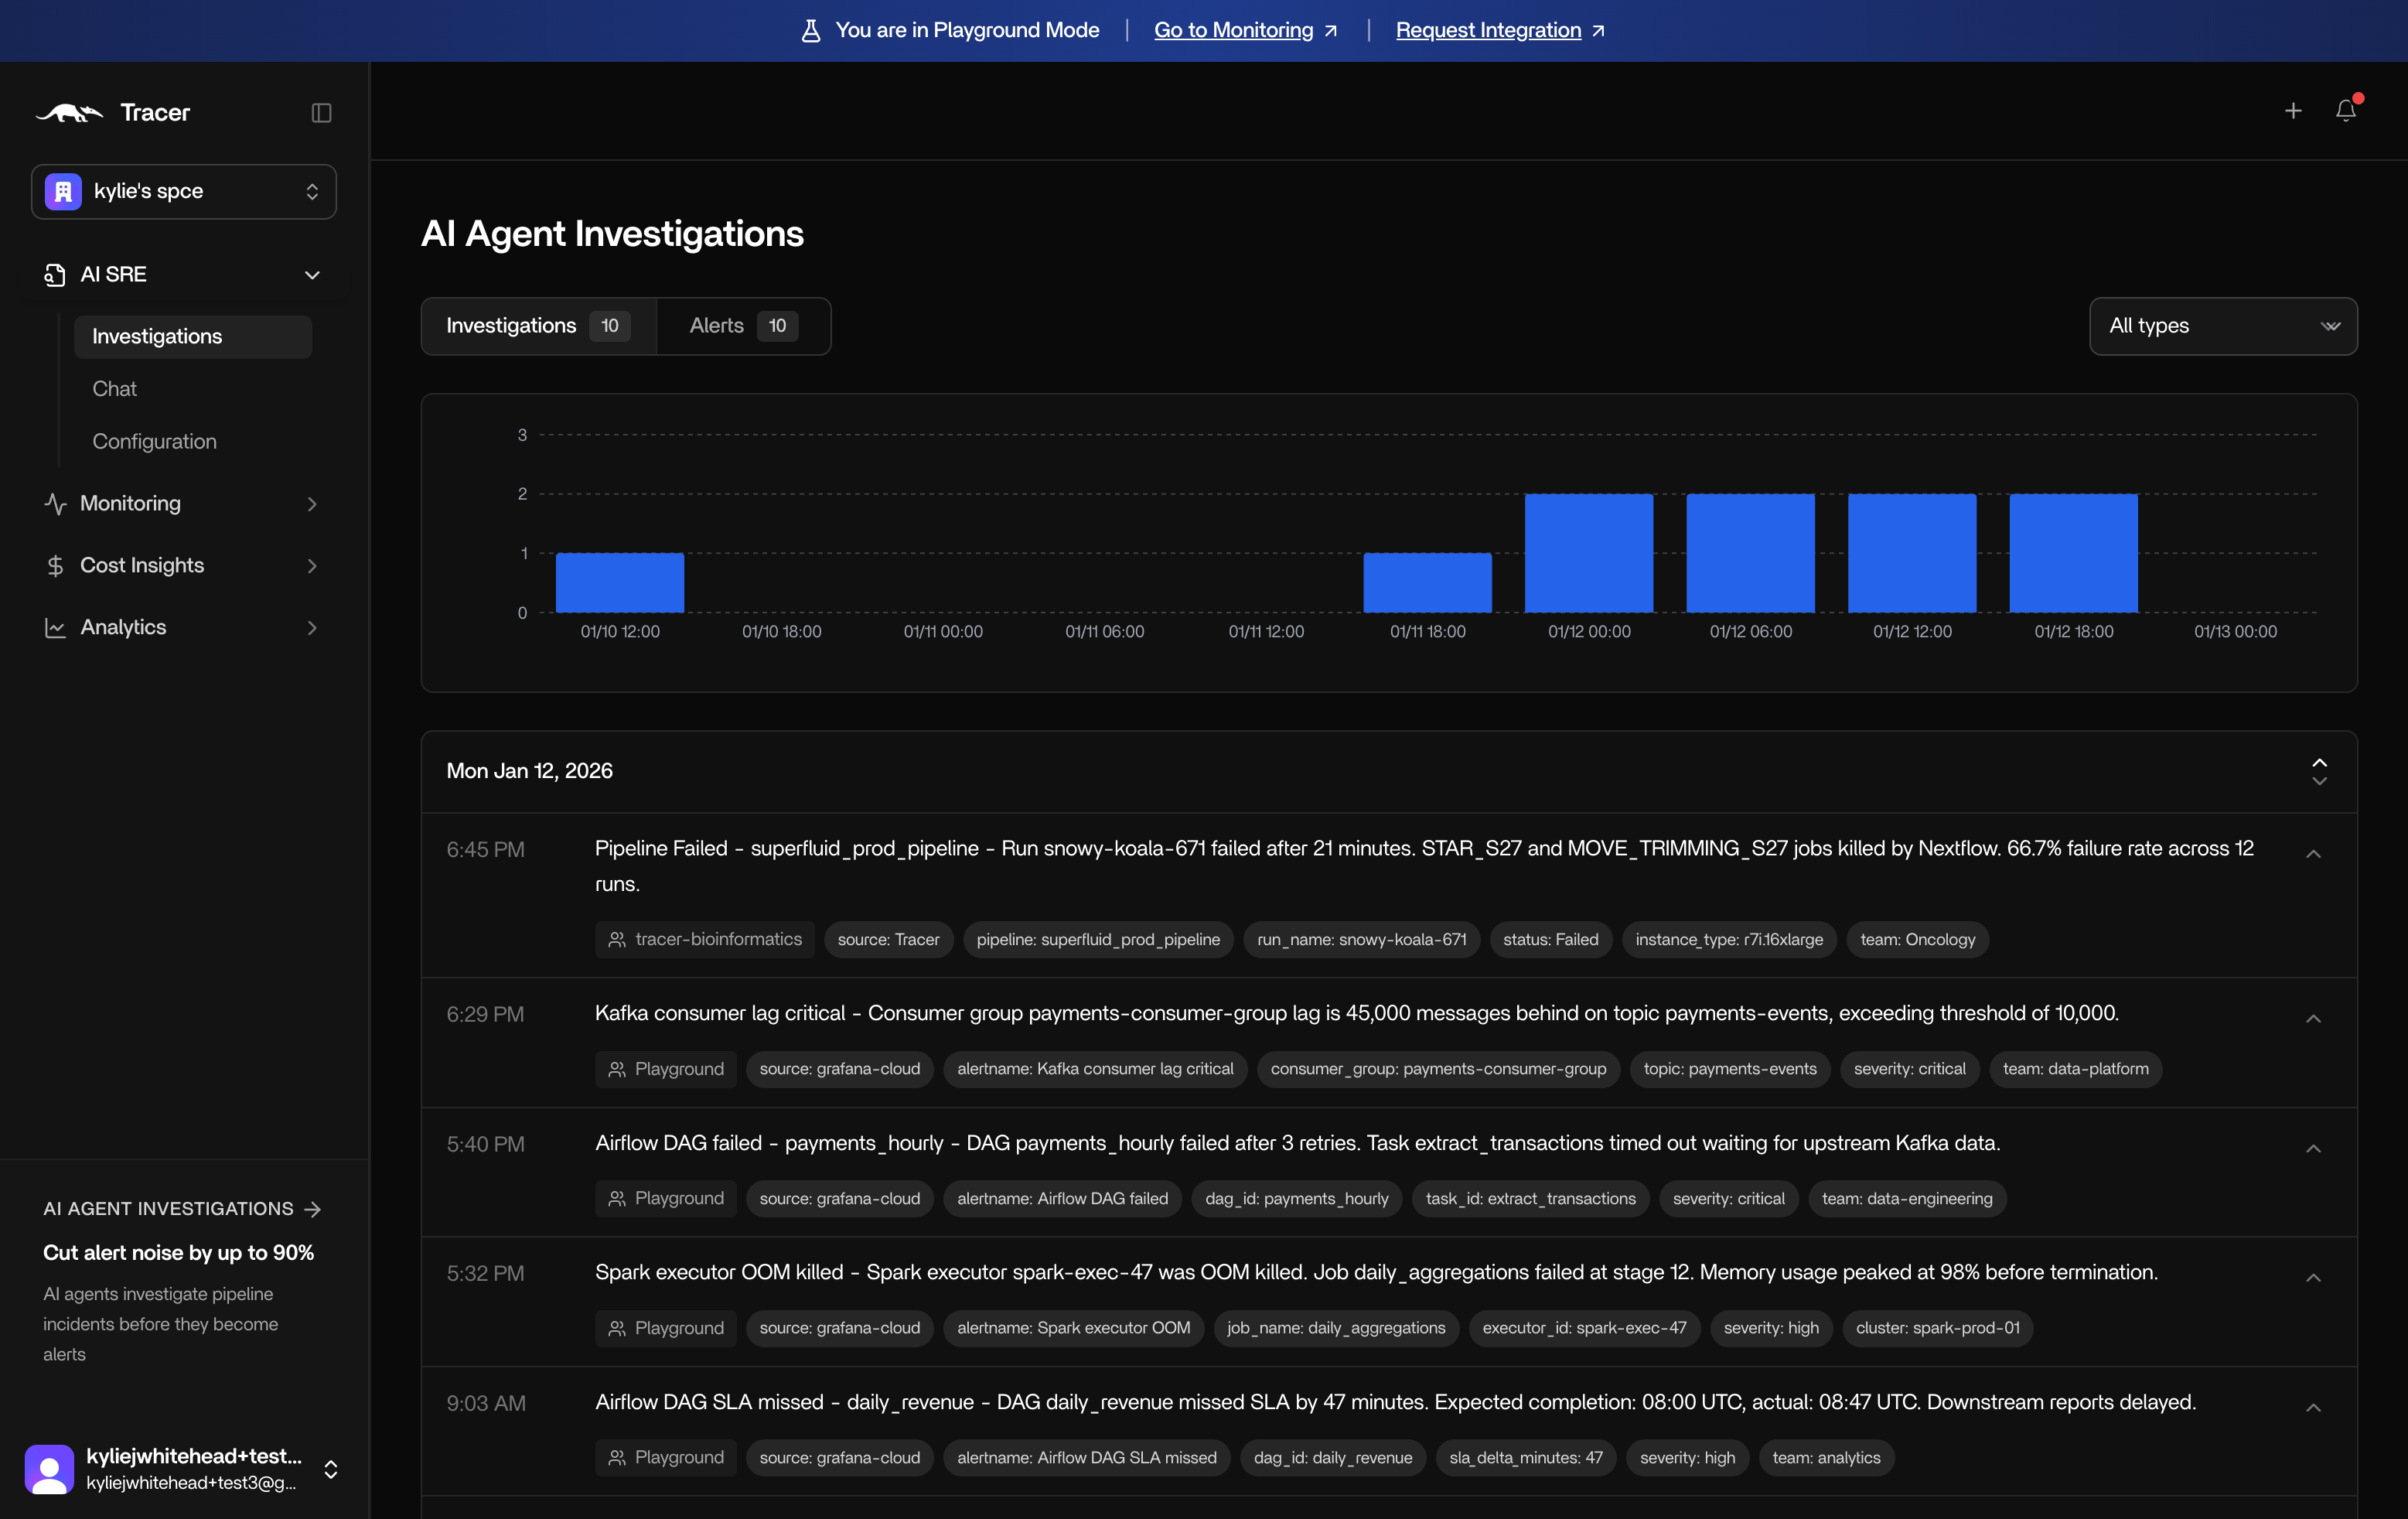
Investigations overview. This page shows all past investigations, sorted by date. Click into an investigation for more detail.
-
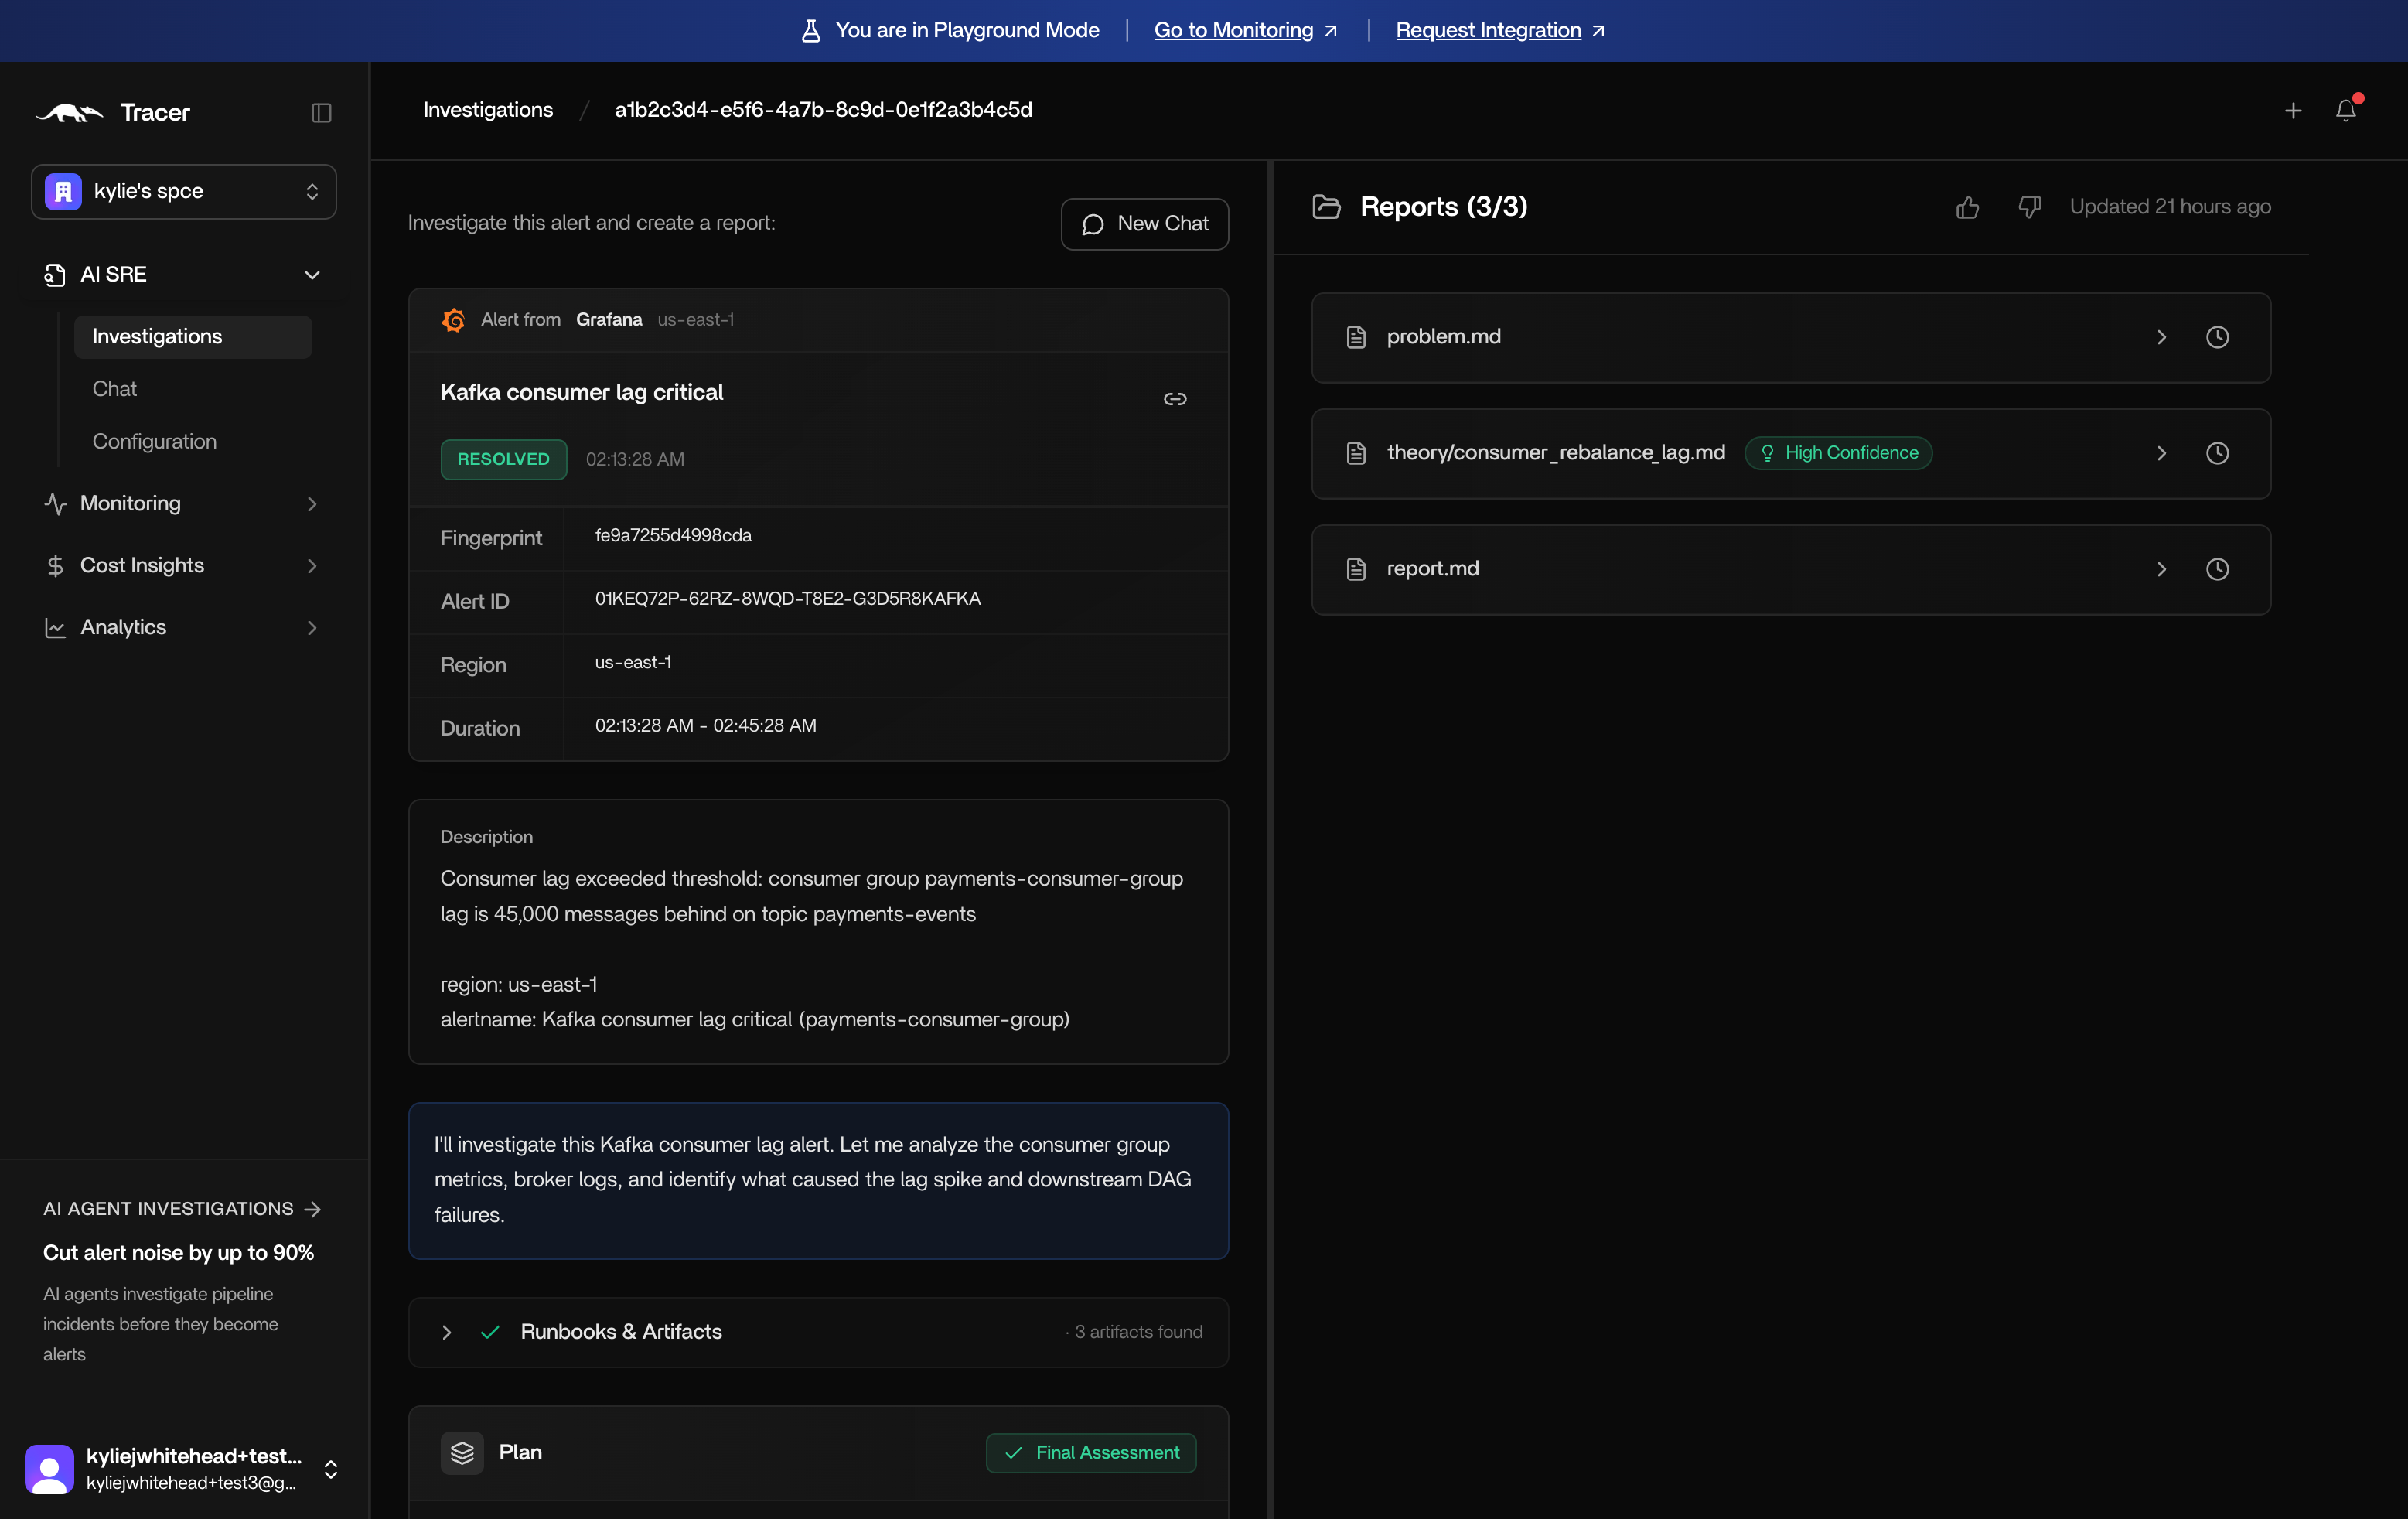
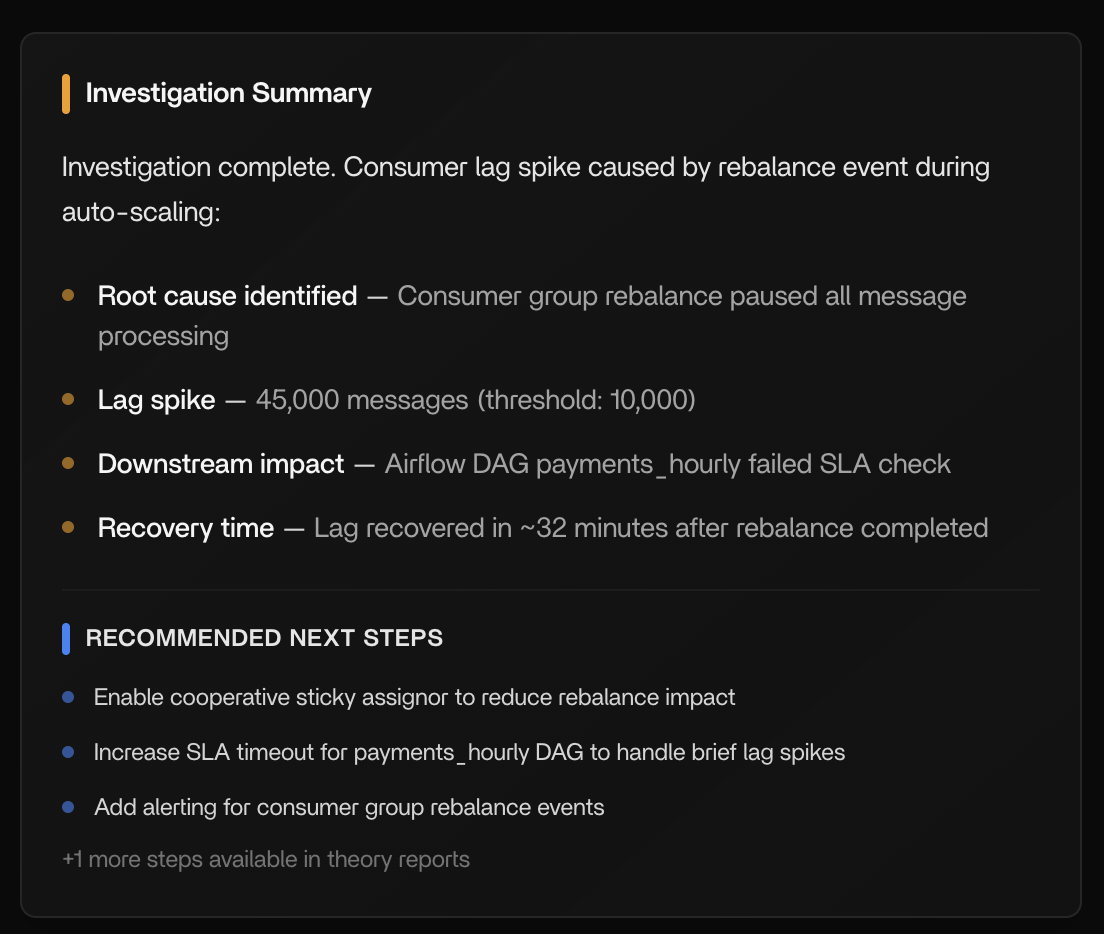
Investigation summary. Click into an investigation for a breakdown of what happened.
-
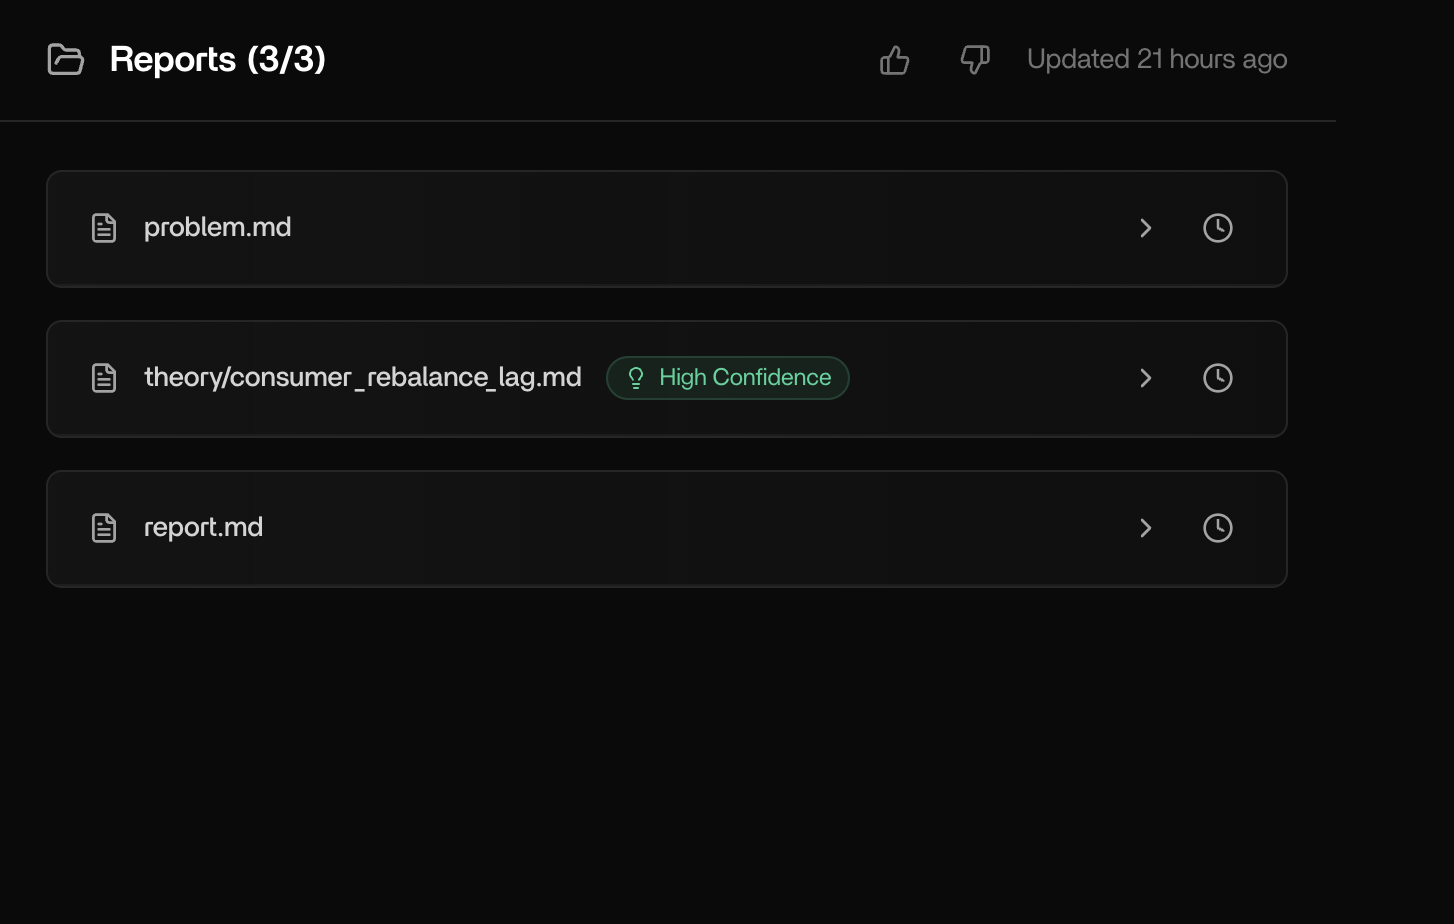
Reports. On the right hand side of an investigation page, you’ll find a minimum of 3 investigation reports.
- problem.md - This report includes a description of the problem as understood and preliminary investigation.
- theory/hypothesis_x.md - This report shows the root cause hypothesis that was tested following dependency investigation. Depending on how many root cause hypotheses were tested, you may see multiple reports.
- report.md - This report shows you a summary of the investigation.
-
Summary. On the left hand side of an investigation page, you’ll see the full summary of the investigation including:
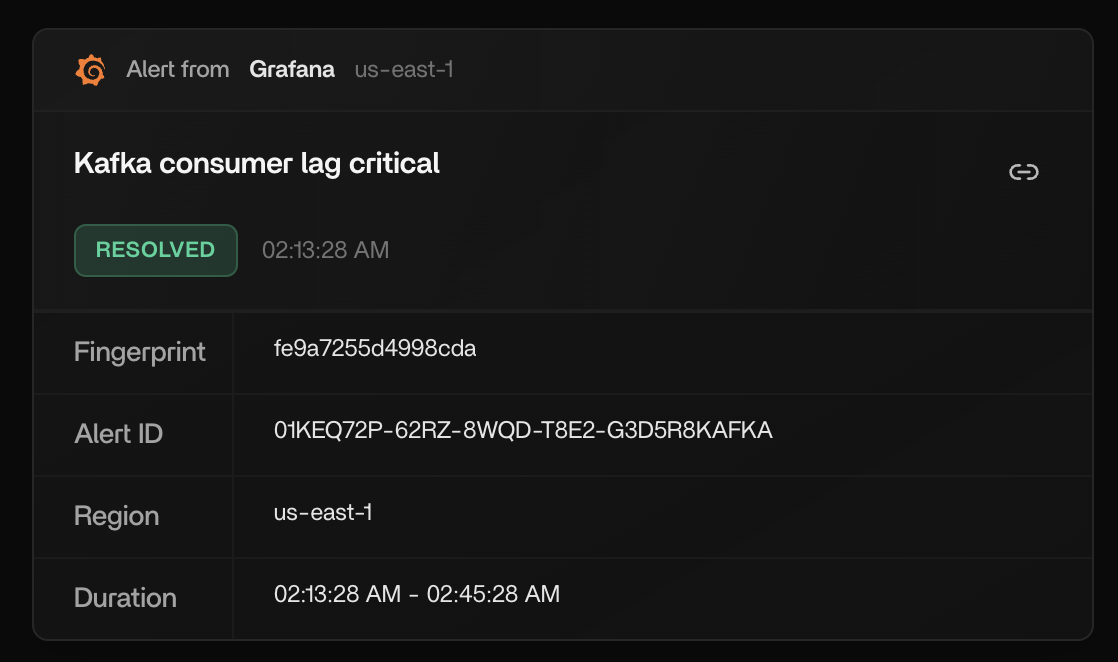
- Alert - The original alert
-
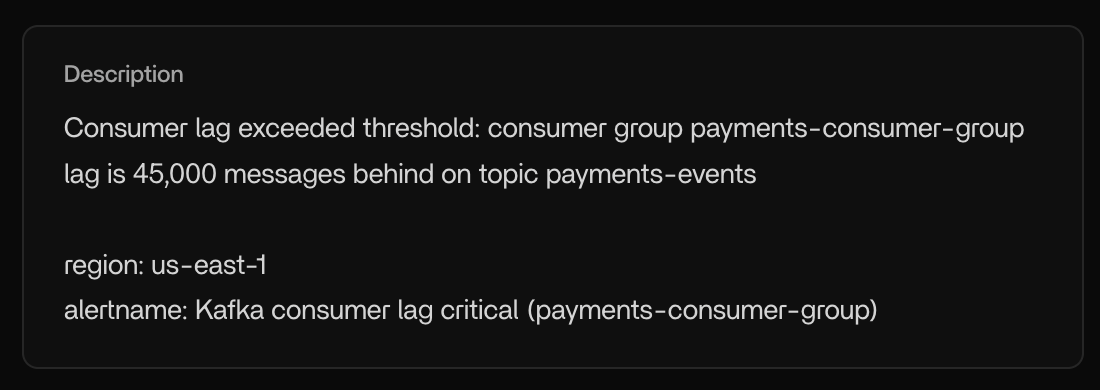
Description - A description of the issue in plain English.
-
Process - The process Tracer followed to investigate the issue including:
-
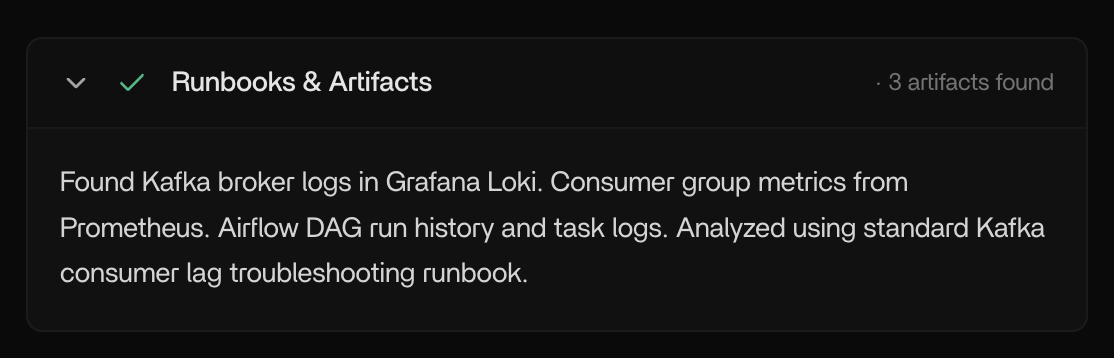
Runbooks and artifacts consulted by the AI agent
-
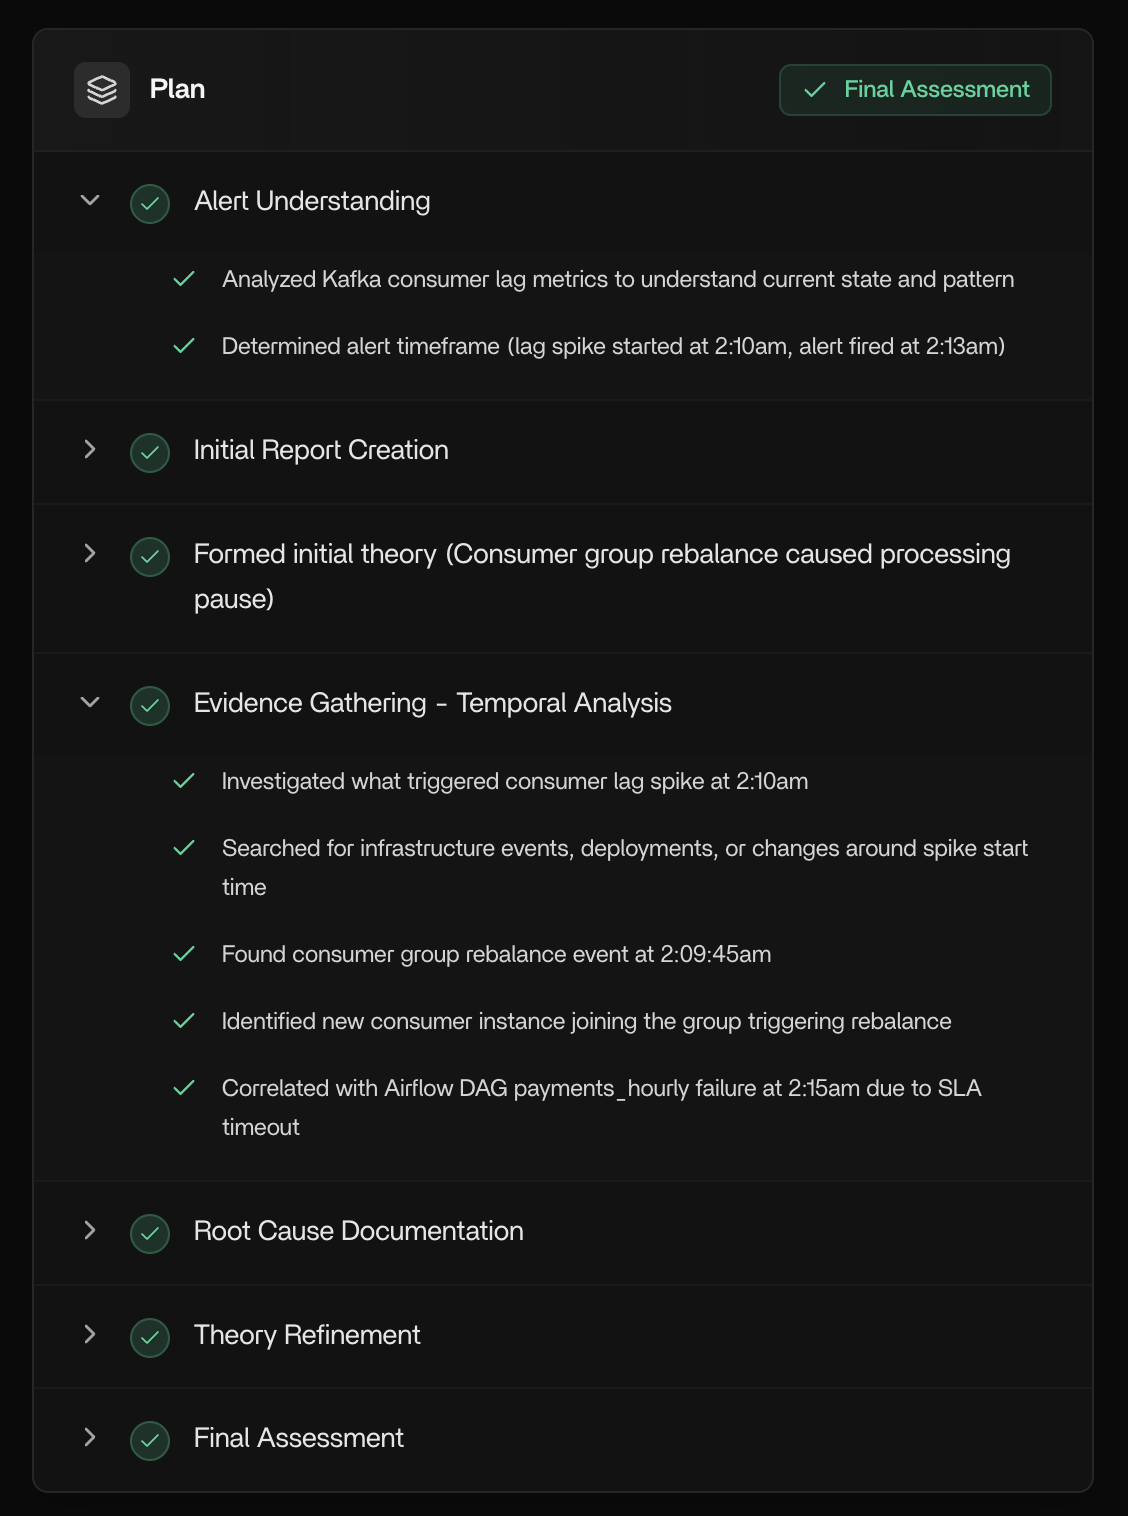
Plan - the steps the AI agent(s) took to investigate the issue
-
Investigation summary and recommended next steps
-
Runbooks and artifacts consulted by the AI agent
Chat
You also have the option to chat with the report if you want to dig deeper.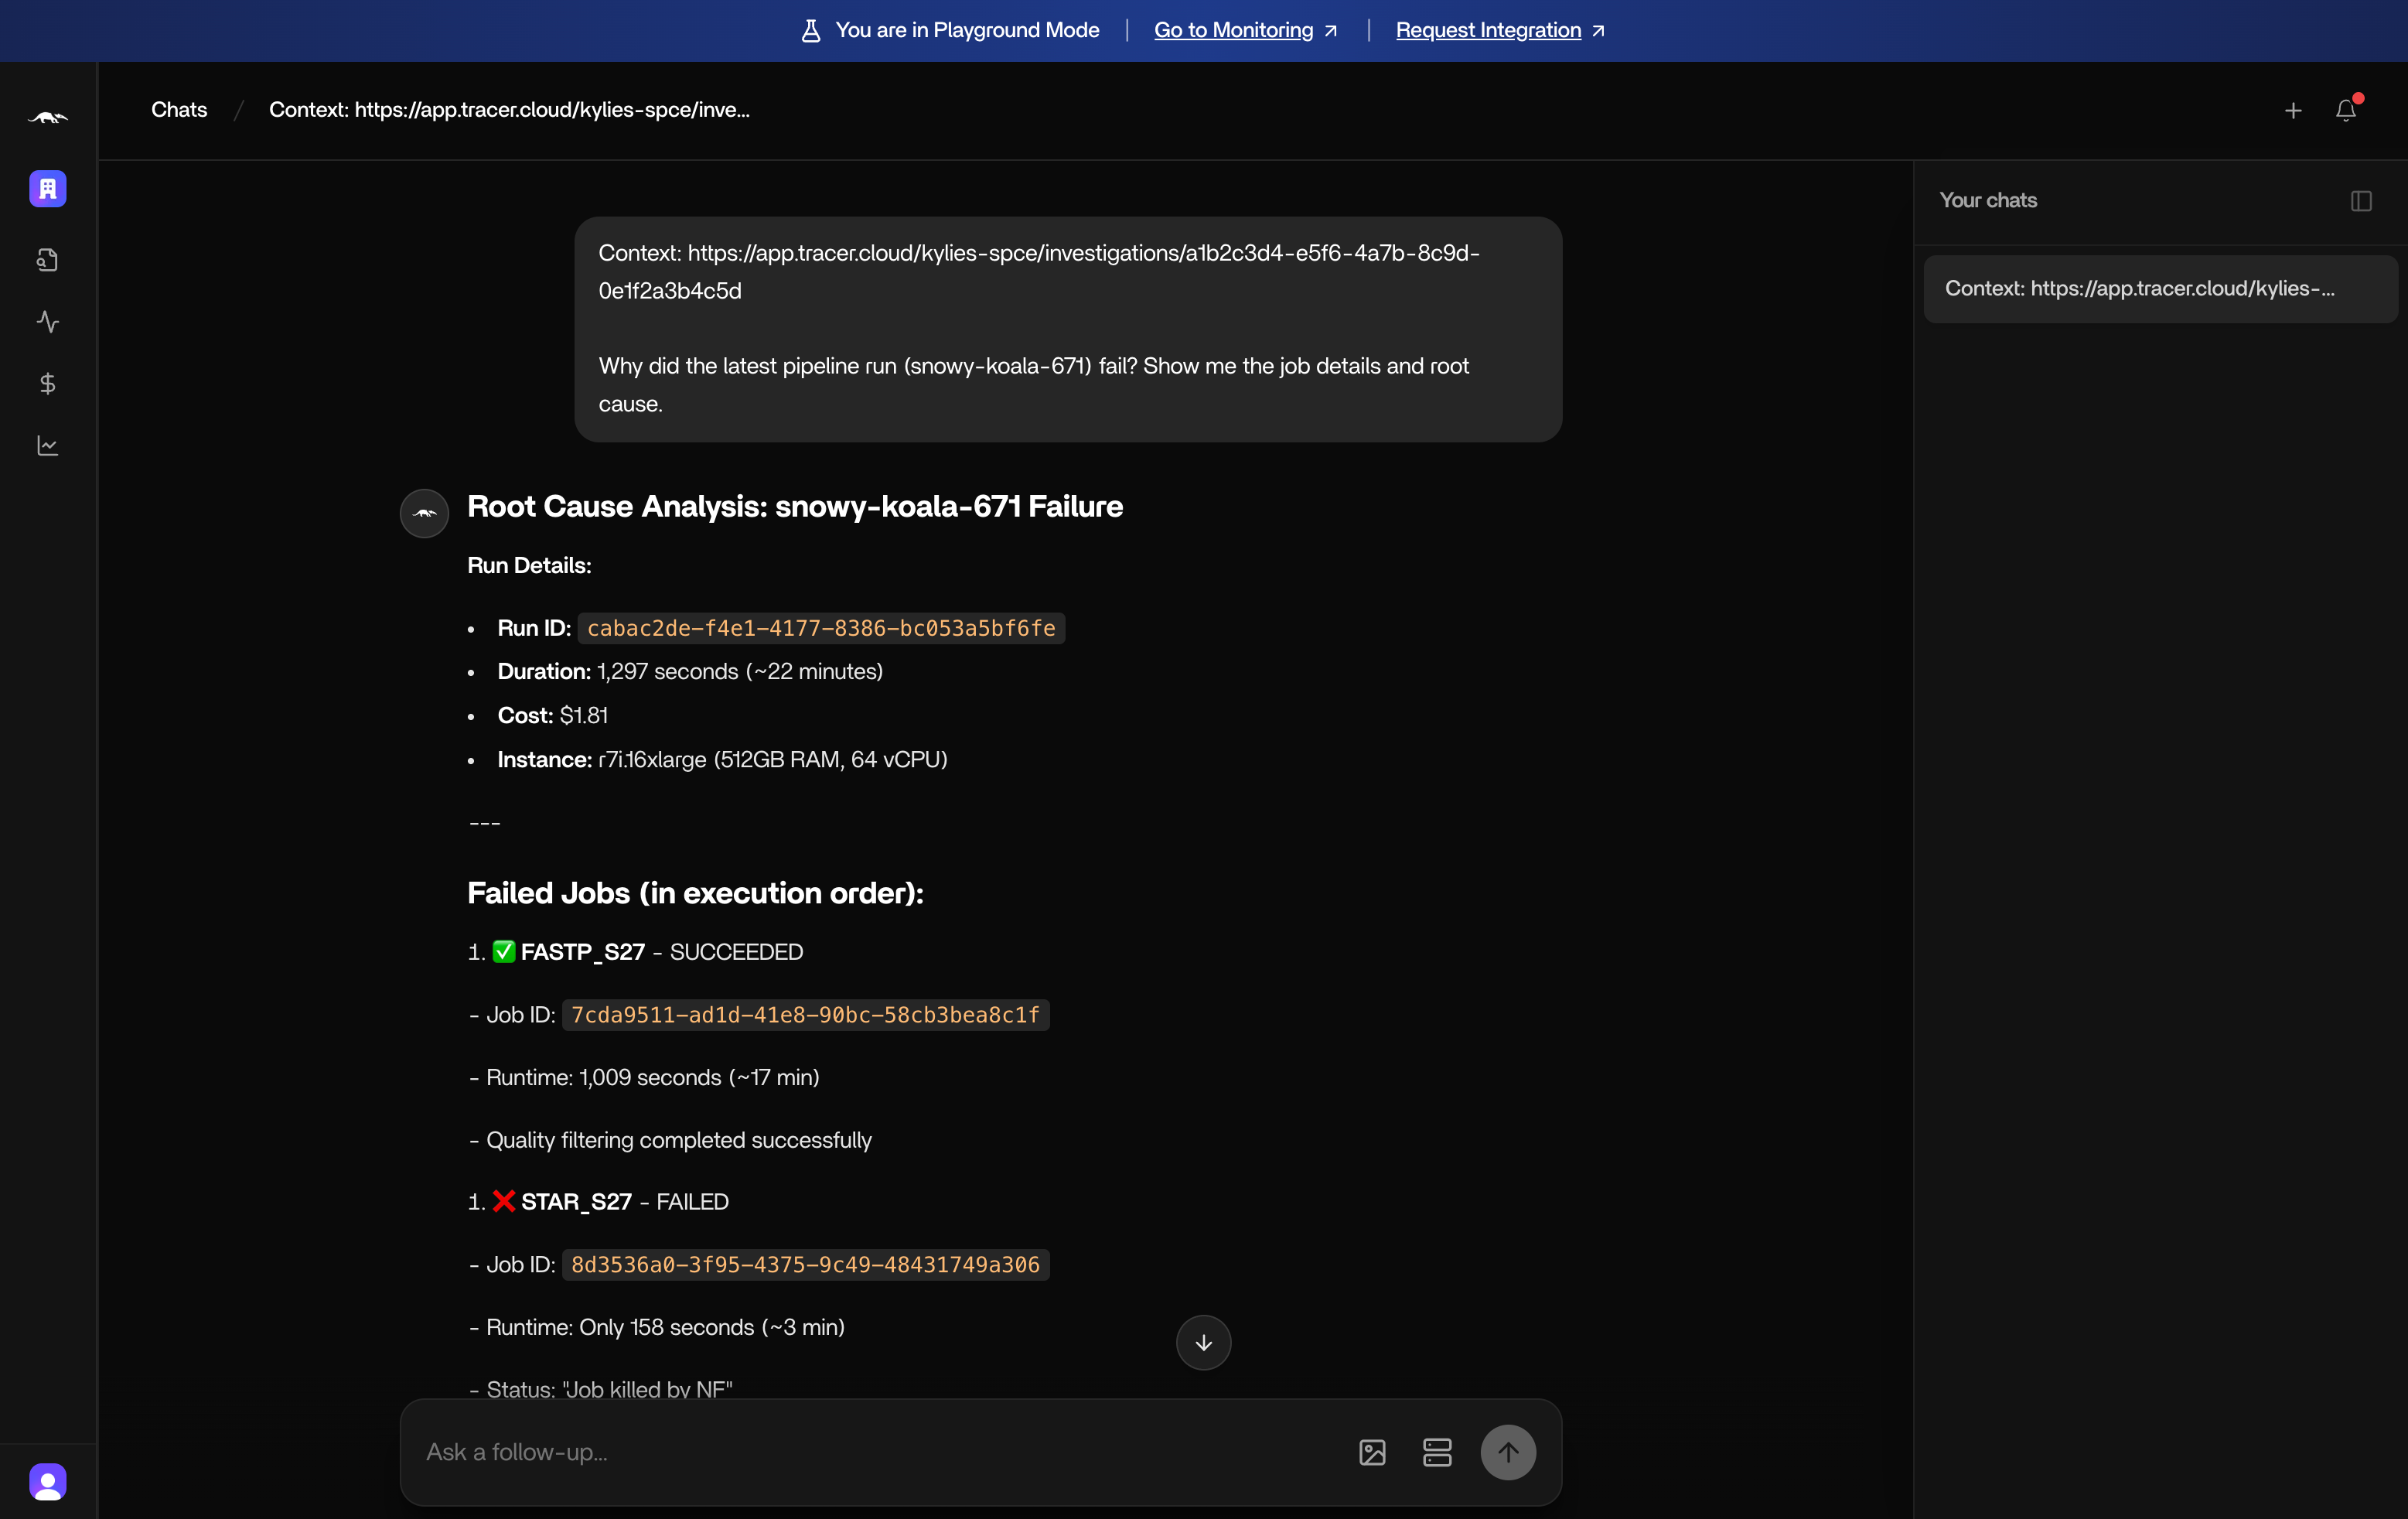
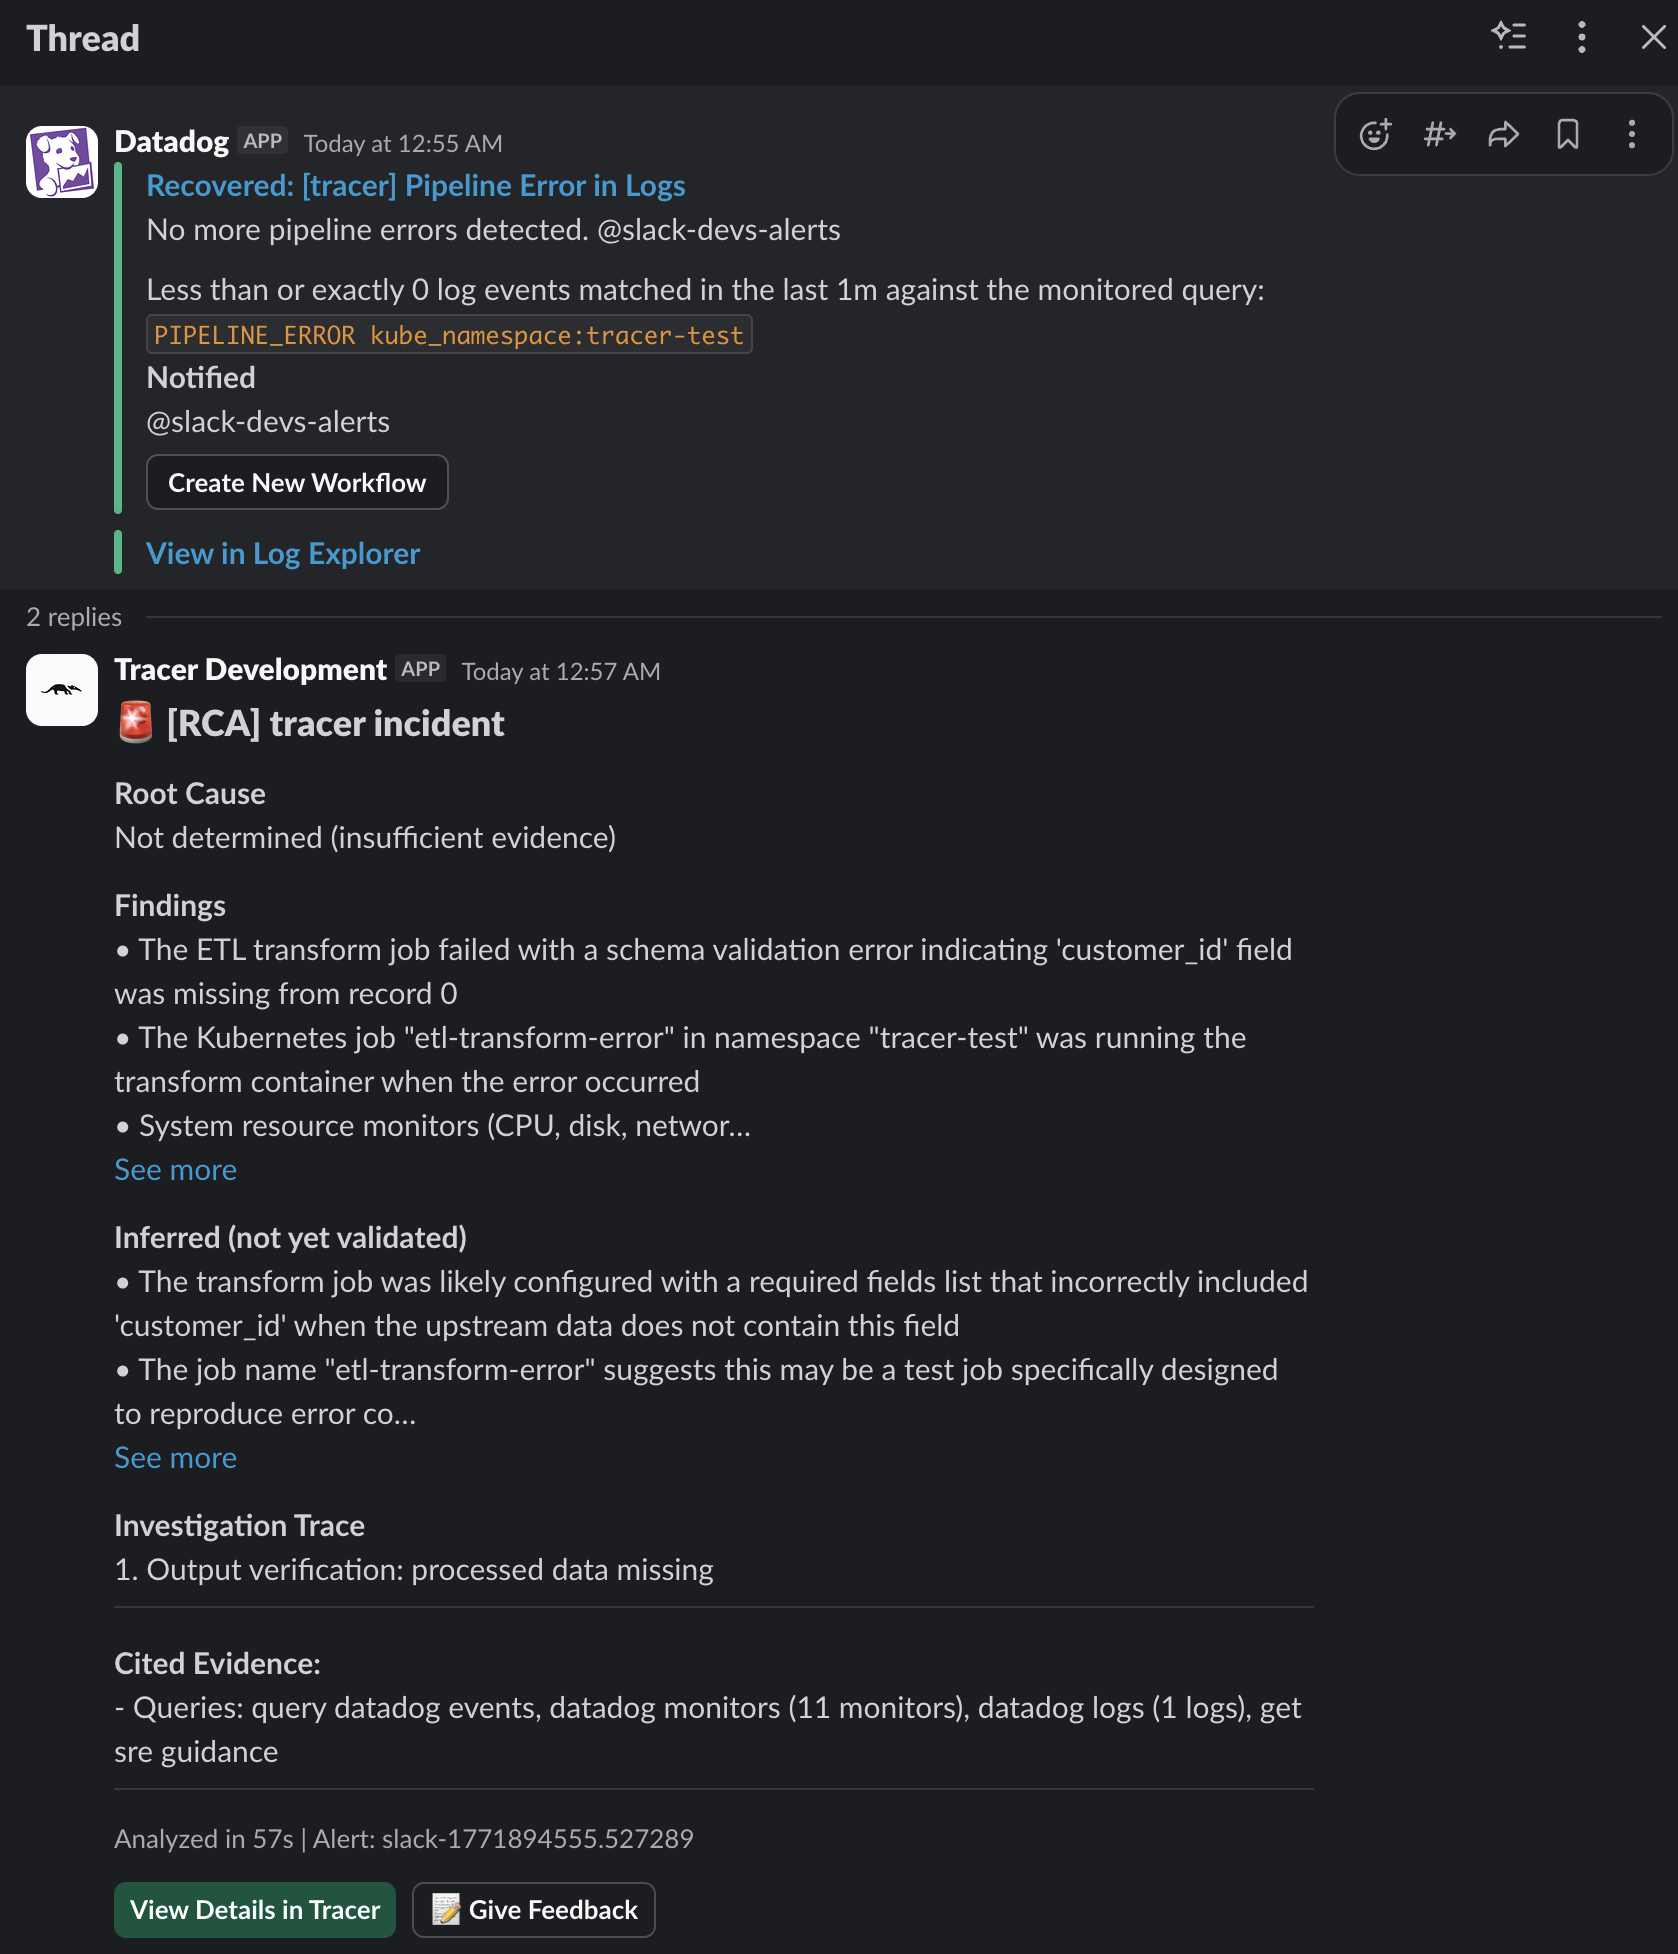
Slack reports
If you’ve set up the Slack integration, Tracer will send a concise investigation summary into Slack.