Cost Analysis
Cost Analysis shows compute spend at the cluster, namespace, and workload levels. Tracer combines cloud billing information with execution signals such as CPU usage, memory usage, and process activity.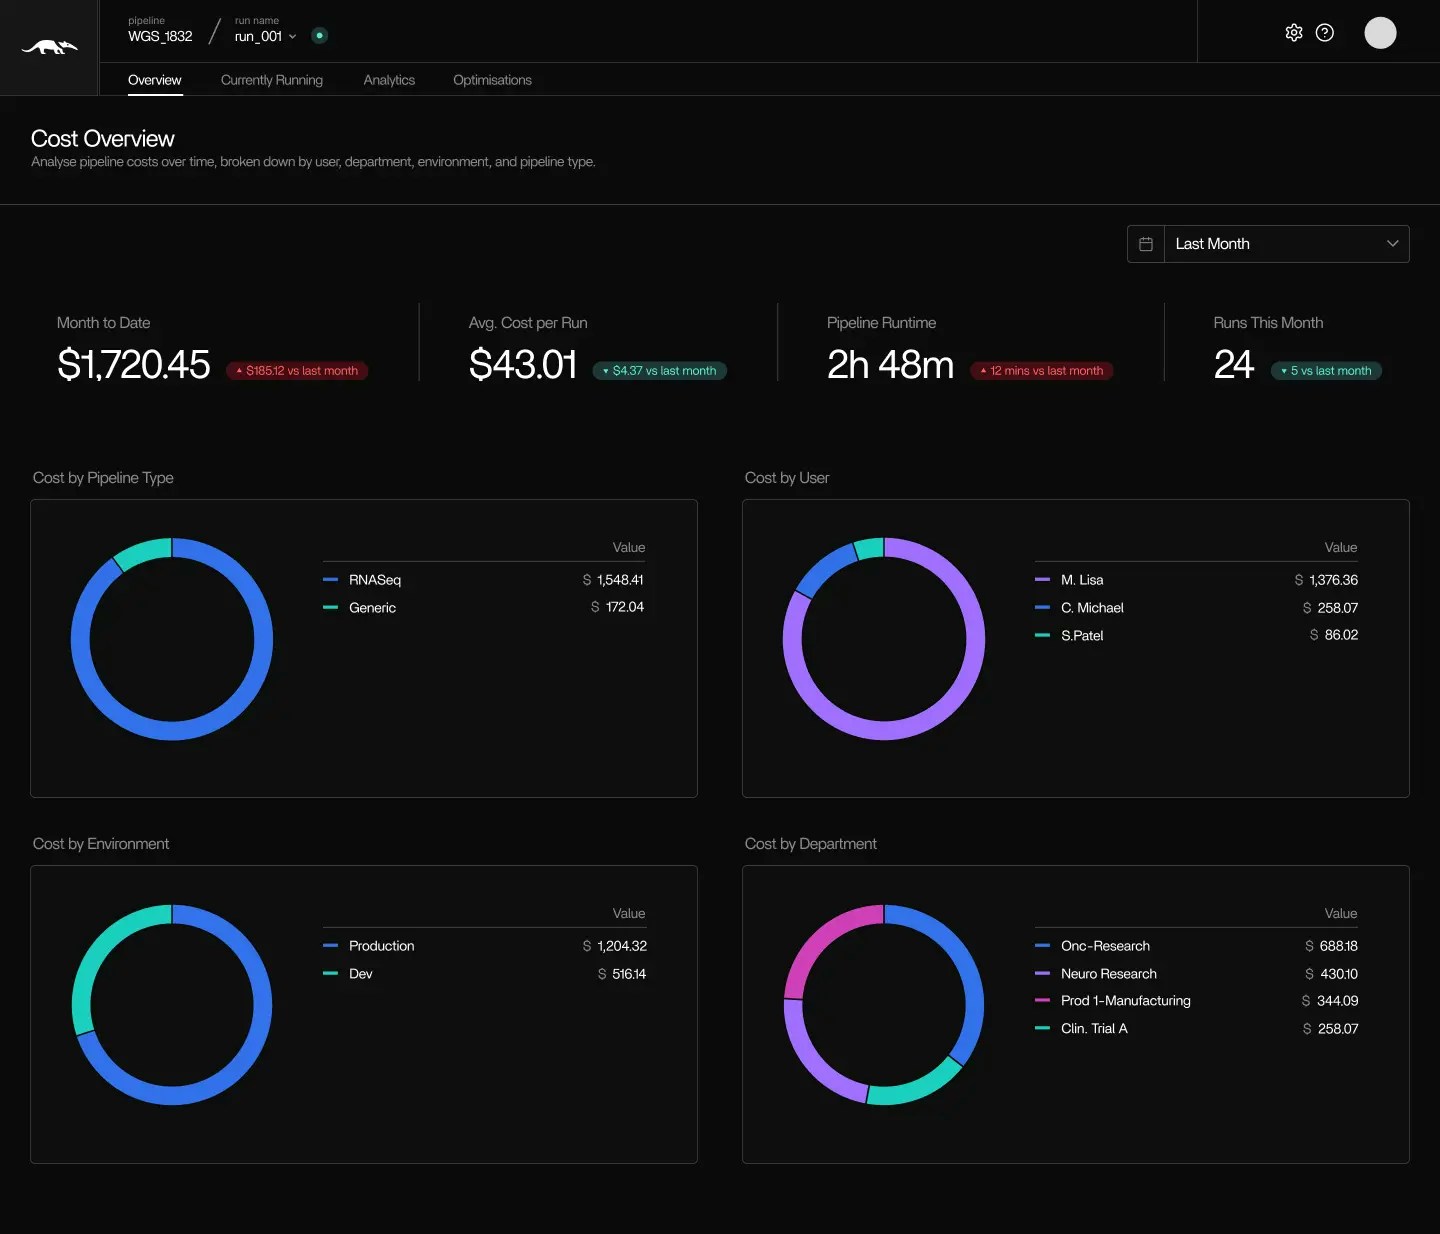
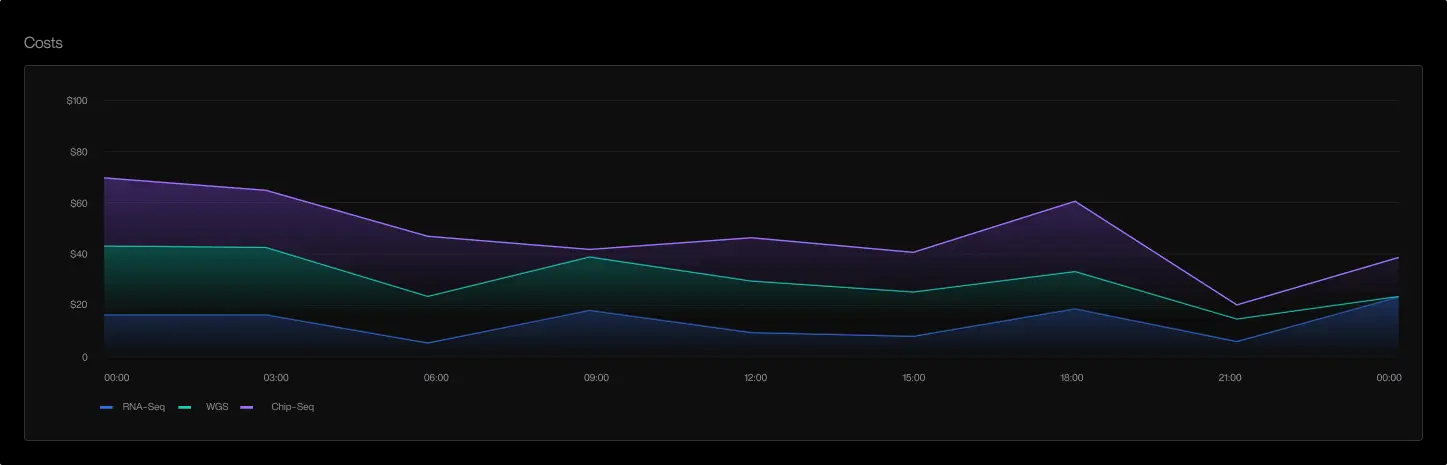
- Review cost patterns over time
- Identify workloads that consistently use more or fewer resources than expected
- Compare cost across pipeline runs
- Pinpoint costs by container, tool, job, and run
- Detect over-allocated or under-allocated configurations
- Attribute costs by pipeline type, user, environment, or cost department
Resource Efficiency Detection
Tracer evaluates runtime behavior to highlight potential inefficiencies. Examples include:- Instances that use only a fraction of their allocated CPU or memory
- Workloads with low execution activity relative to provisioned capacity
- Containers that remain active after their tasks complete
- Nodes that stay online without active workloads
These findings are based on measured execution signals, not predictions or estimates. They can help identify where right-sizing or consolidation may reduce cost.
No Automatic Optimization
Tracer does not apply automatic scaling decisions, shut down resources, or change workload configurations. All adjustments remain under your control. The platform provides execution and cost information that can be used to guide manual optimization efforts. You can also explore related capabilities in Tracer/tune and Tracer/sweep:Tracer/tune
Optimize specific pipelines and workloads
Optimize specific pipelines and workloads
Tracer/sweep
Systemwide cloud waste detection
Systemwide cloud waste detection