

Overview
Tracer/collect provides low-overhead, high-fidelity visibility into scientific and cloud-based high-compute workflows.Framework-agnostic
Works with any workflow engine, scheduler, language, or container runtime.
Safe and efficient
Uses kernel tracing without modifying system binaries or requiring code changes.
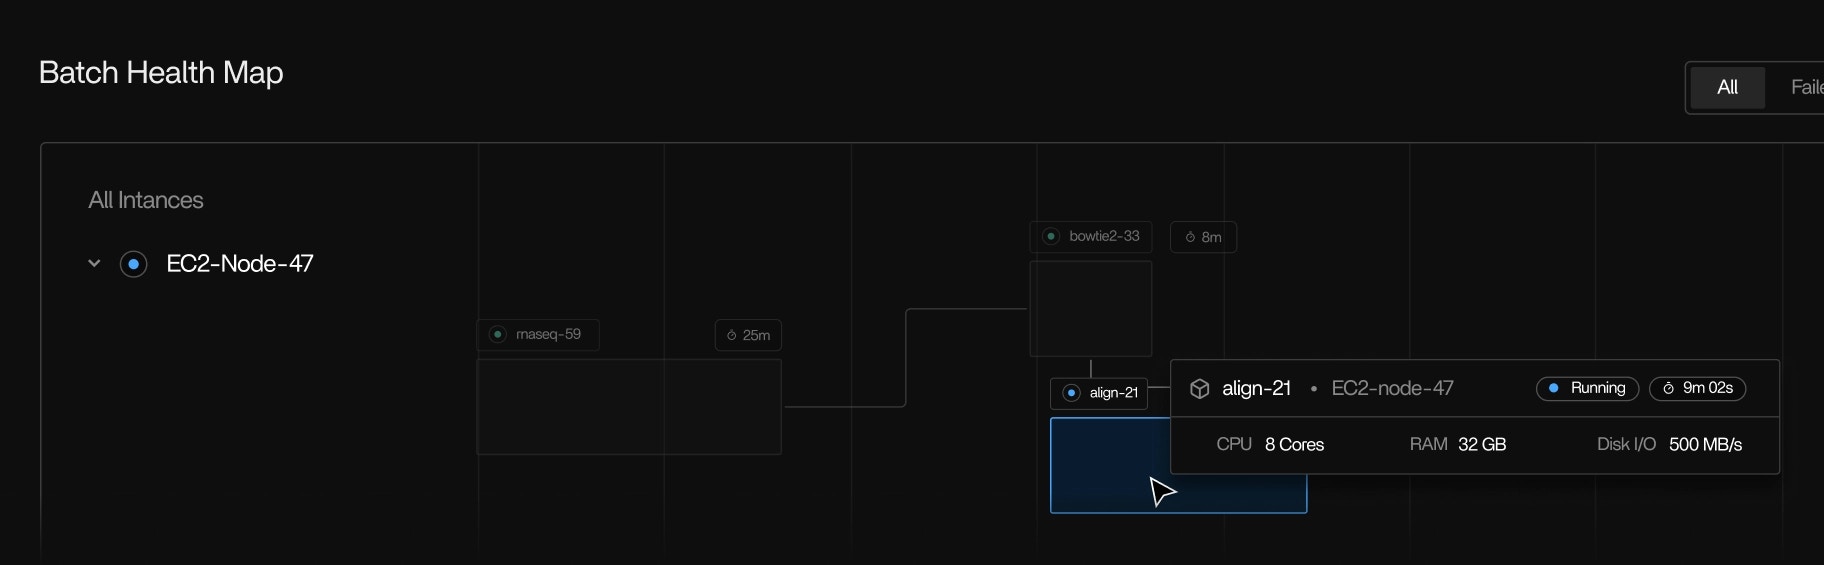
Actionable
Produces data that describes what ran, where it ran, and how resources were consumed.
How Tracer/collect works
Tracer/collect is built as a static Rust daemon that orchestrates eBPF programs to observe the Linux kernel.Kernel-level observability with eBPF
Tracer/collect uses eBPF (extended Berkeley Packet Filter) to attach probes at key points in the operating system. eBPF is a verified, sandboxed execution environment in the Linux kernel that lets user-space programs monitor kernel events safely and efficiently. Using eBPF, Tracer/collect observes:- System calls and scheduling events: when processes start, stop, or yield CPU
- Resource activity: CPU usage, memory usage, I/O operations, and network activity
- Process lifecycles: which binary ran, with what arguments, and in which container context
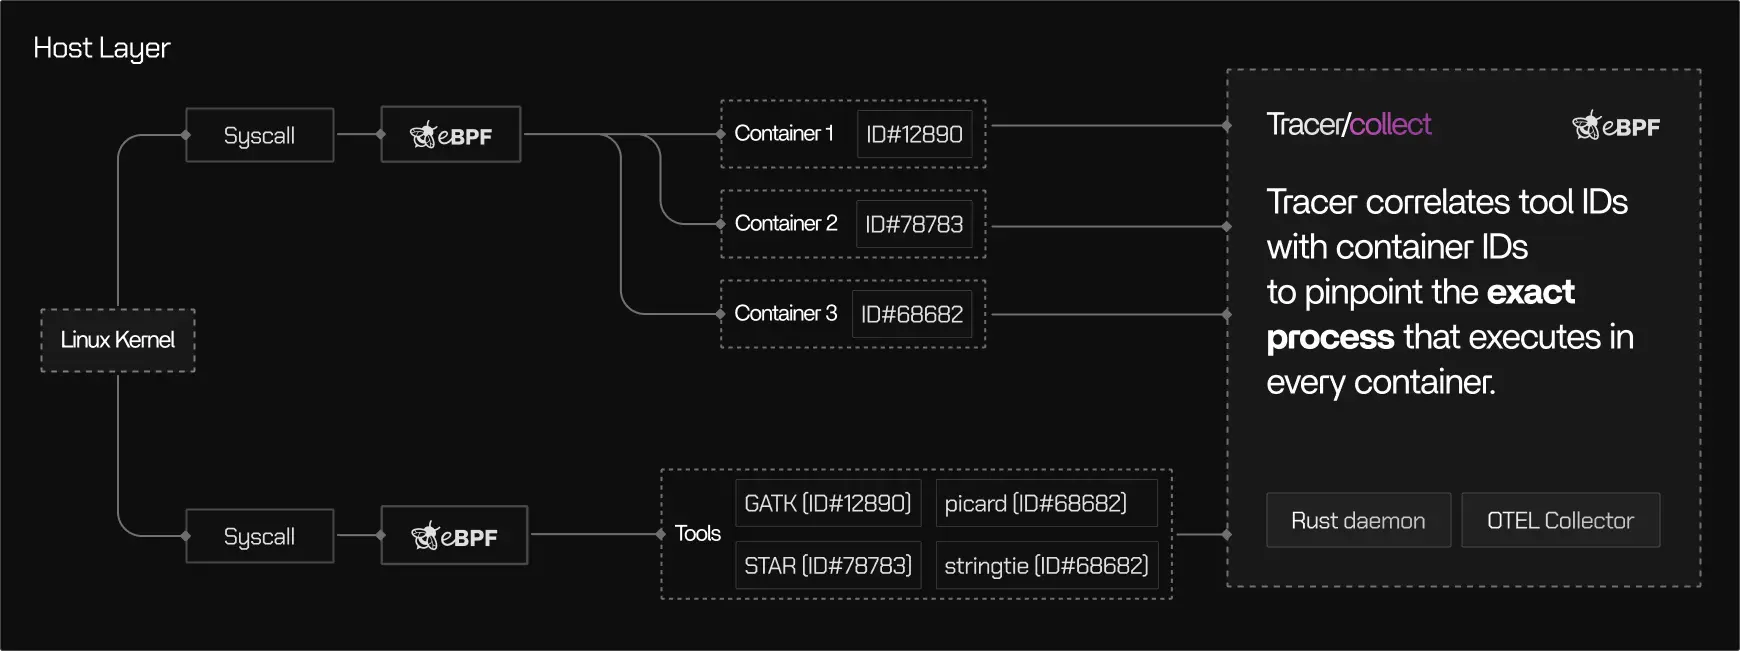
Correlation through identifiers
Tracer/collect correlates kernel events with higher-level execution semantics by using identifiers that the Linux kernel exposes:- Process IDs (PIDs) and parent PIDs
- Namespaces and cgroups that define container boundaries
Data collection stages
Tracer/collect’s internal workflow can be understood in four stages:Attach
eBPF probes attach to kernel trace points such as system call entry/exit and scheduler events. No application changes or container restarts are required.
Capture
Kernel events are streamed into the daemon. Only relevant events, those associated with processes running scientific tools or workflow steps, are selected through filtering rules.
Correlate
Events are linked to processes, containers, and pipelines using kernel metadata and optional scheduler-provided trace identifiers.
Filtering and relevance
Kernel probes can generate a high volume of events. Tracer/collect minimizes overhead and focuses on meaningful signals by applying filter rules at the source.Include rules
Events that correspond to known tools, binaries, or workflow steps
Exclude rules
Generic system activity that is not useful for pipeline observability
Deployment and lifecycle
Tracer/collect is designed for modern compute environments:- It runs as a daemon on each host.
- It can be installed via launch scripts, imaging systems, or orchestration tools (cloud init, configuration management, container DaemonSets).
- The daemon is self-updating and resilient to intermittent network issues.
Performance
Tracer/collect is optimized for minimal interference with workloads:Low CPU overhead
Typically under 2% for most workloads
Minimal I/O impact
Event sampling and filtering reduce data volume early
Safe memory usage
Rust’s safety guarantees reduce crash risk on production systems
Typical overhead measurements come from controlled benchmarks on pipeline runs.
When to use Tracer/collect
Use Tracer/collect when you want accurate, system-level insight into pipeline execution without modifying your workloads. You should deploy Tracer/collect when:- Your pipelines are stable but slow or expensive, and you need to understand resource and time usage.
- You run heterogeneous workflows that span multiple tools, languages, and schedulers.
- You need visibility inside containers and host processes at the execution boundary.
- Application-level instrumentation is impractical or unavailable.
- You want out-of-the-box insights that point you to the right optimization targets.
Limits and boundaries
Instead, it surfaces resource and execution patterns that help you decide where deeper investigation belongs.Why Rust?
Rust enables Tracer/collect to be:Memory-safe
Reducing the risk of crashes or undefined behavior
Efficient
Low runtime overhead
Portable
A single static binary that runs consistently across environments